leaflet-challenge
Overview
This project is a two-part data visualization challenge using Leaflet.js and D3.js to explore global earthquake data and tectonic plate boundaries. The visualizations use interactive maps to provide insights into earthquake magnitudes, depths, and their correlation with tectonic plate boundaries.
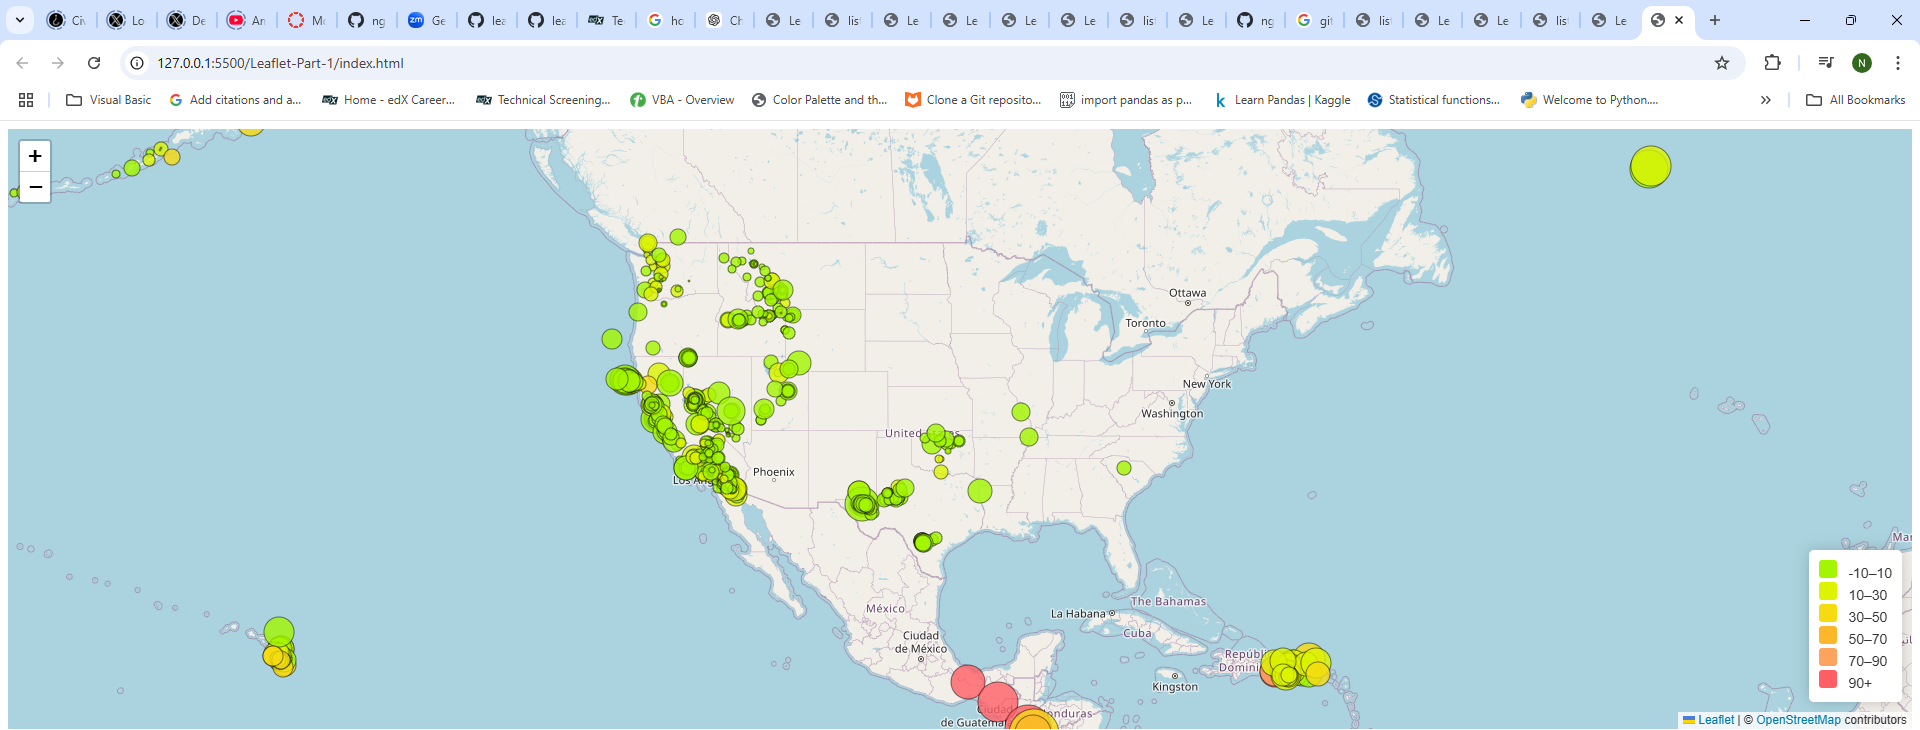
Part 1: Earthquake Visualization
Features:
- Fetches earthquake data from the USGS GeoJSON API.
- Visualizes earthquakes as circle markers on a map.
- Circle Size: Proportional to the earthquake’s magnitude.
- Color: Indicates the depth of the earthquake.
- Popups display information about each earthquake, including location, magnitude, and depth.
- A legend explains the color scale for earthquake depth.
Screenshot:
 —
—
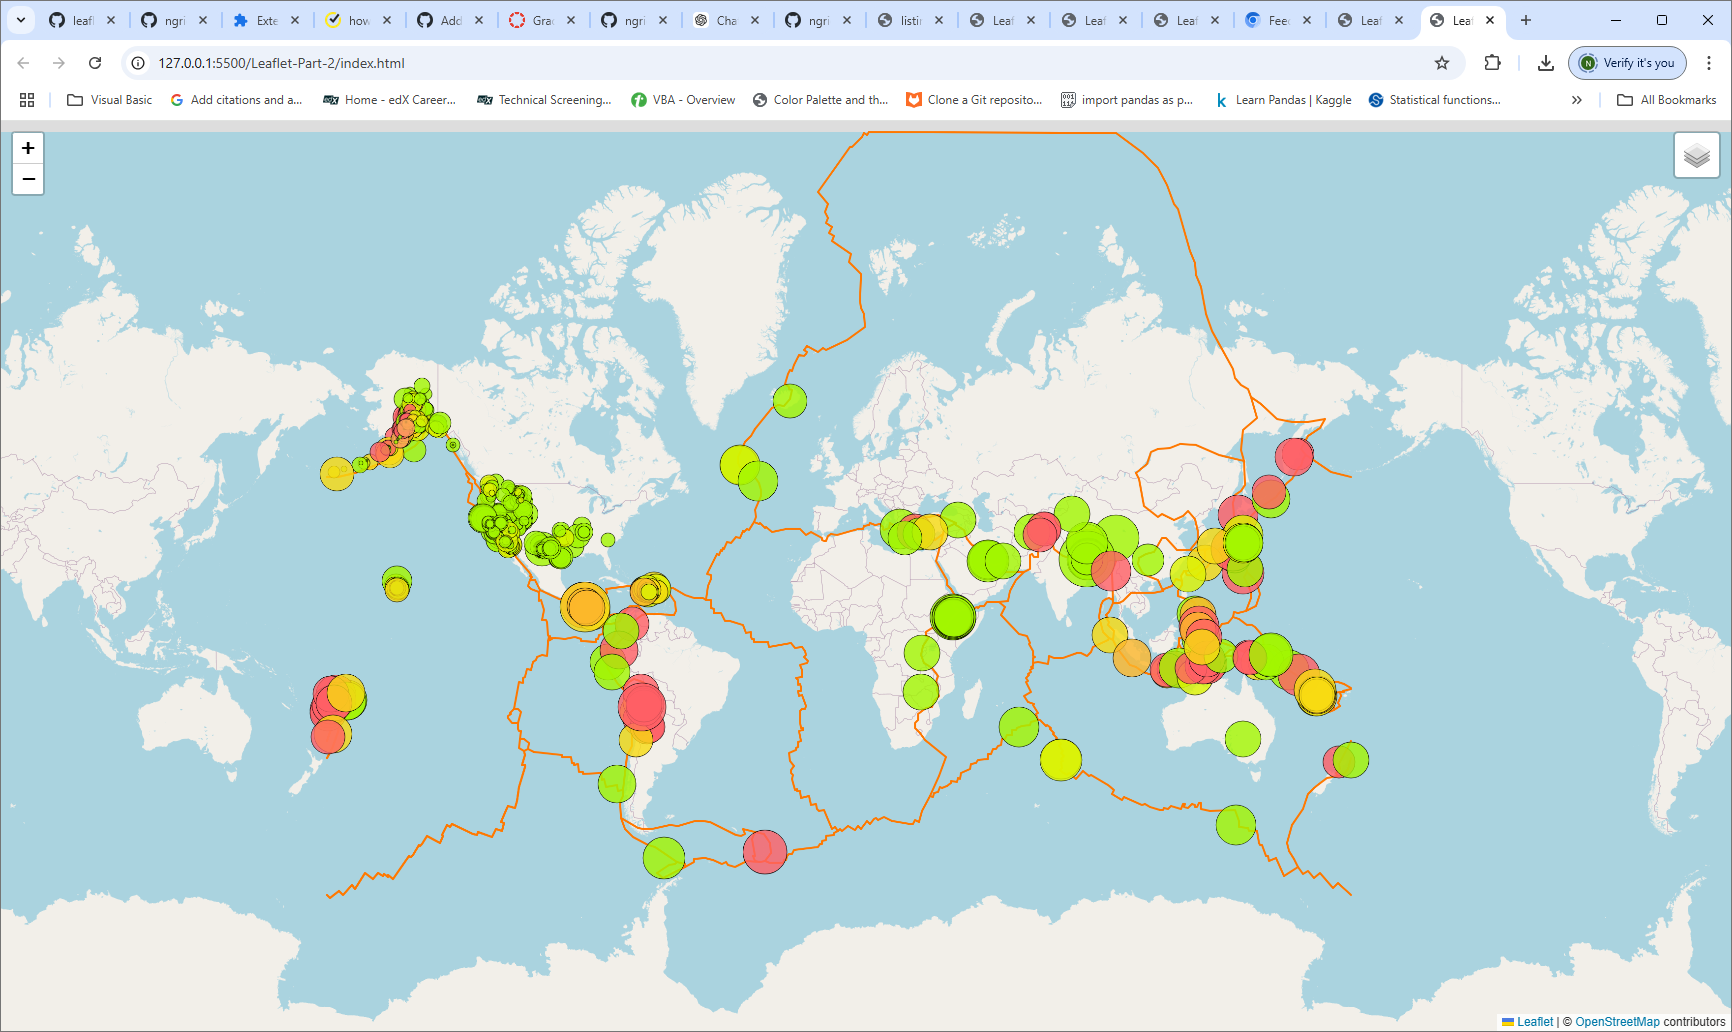
Part 2: Earthquakes and Tectonic Plates
Features:
- Builds on Part 1 by adding tectonic plate boundaries using data from the Tectonic Plates GitHub repository.
- Integrates multiple map layers:
- Base Maps:
- Street Map
- Satellite Map
- Overlay Layers:
- Earthquake data
- Tectonic plate boundaries
- Base Maps:
- Users can toggle layers using an interactive control panel.
- Earthquake data and tectonic plates are styled and displayed with unique visuals for clarity.
Screenshot:
 —
—
Technologies Used
- Leaflet.js: For interactive map rendering.
- D3.js: For data fetching and processing.
- HTML/CSS/JavaScript: Core web technologies for structure and interactivity.
- USGS GeoJSON API: For earthquake data.
- Tectonic Plates GitHub Repository: For tectonic plate boundary data.
Getting Started
Prerequisites:
- A browser capable of running modern JavaScript (e.g., Chrome, Firefox).
- Optionally, a local HTTP server for testing (e.g., Python, Node.js).
Instructions:
- Clone this repository: ```bash git clone https://github.com/ngrief/leaflet-challenge.git